What is a Fishbone Diagram?
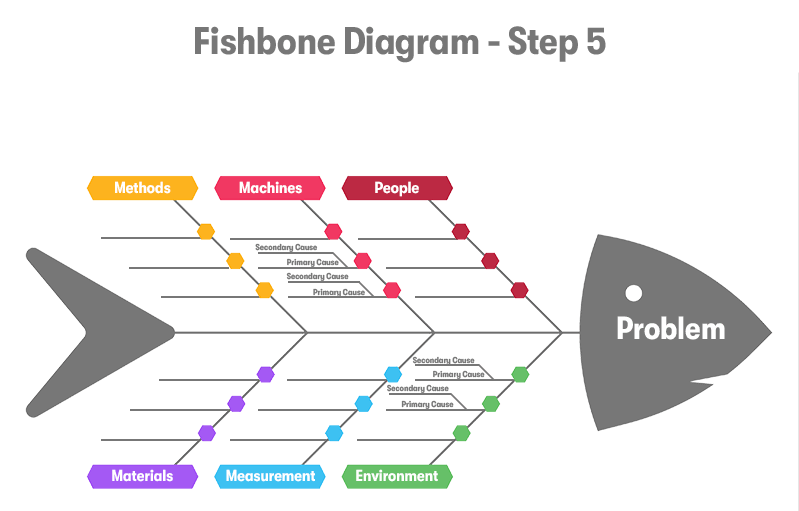
A Fishbone Diagram, also known as an Ishikawa Diagram or a Cause-and-Effect Diagram, is an analytical tool that helps identify the root causes of a problem. It has a shape resembling a fish skeleton, with the “fish head” representing the issue to be addressed and the “bones” representing the potential underlying causes. This method is part of the 7 QC Tools—a set of tools used for quality management and control.
Read more: https://en.wikipedia.org/wiki/Ishikawa_diagram
https://www.coursera.org/articles/what-is-fishbone-diagram
This diagram, along with the 7 QC Tools, was developed by Kaoru Ishikawa in the 1960s, a Japanese management scientist. He introduced this method during quality control processes to help Japanese businesses improve production. Today, it is widely used across various fields, from manufacturing and business to project management, for data analysis and making decisions based on the root causes of problems.
Example of a Fishbone Diagram.

What does a Fishbone Diagram signify?
- It helps to provide an overall view of the causes of a problem.
- It supports the analysis of root causes rather than just addressing symptoms.
- It facilitates group discussions and the development of improvement ideas.
- It aids in decision-making based on data rather than intuition.
- It identifies the causes of a problem in production and business.
- It analyzes errors in project management processes.
- It improves the quality of products and services.
- It assists teams in brainstorming and finding effective solutions.
Cause Analysis: The Fishbone Diagram helps analyze and identify the causes of a problem. By identifying both main and secondary causes, the diagram helps to uncover the relationships between them and pinpoint the primary cause.
Information Organization: The Fishbone Diagram helps organize information clearly and systematically. It allows for the arrangement of influencing factors into specific groups, making it easier for users to see the links and correlations between the factors.
Finding Solutions: The Fishbone Diagram provides a systematic approach to finding solutions to problems. By identifying the primary and secondary causes, users can propose specific measures to eliminate or mitigate the causes of the problem.
Encouraging Thought and Collaboration: The Fishbone Diagram encourages critical thinking and collaboration in problem-solving. By promoting discussion and input from team members, it fosters interaction and the exploration of new solutions.
Multidisciplinary Application: The Fishbone Diagram can be applied in various fields and industries, from quality management, project management, research and development, to healthcare, education, manufacturing, and services.
Example: In the field of manufacturing and quality management, the Fishbone Diagram is used to analyze the causes of product defects or decreased production efficiency. For instance, if a company faces high defect rates, they may use the diagram to analyze causes such as inadequately trained staff (Man), improperly maintained machinery (Machine), substandard input materials (Material), or non-optimized production processes (Method). Accurately identifying the causes helps the business improve its processes, enhance product quality, and reduce error correction costs.
In project management, the Fishbone Diagram helps identify causes of delays, budget overruns, or poor performance. For example, an IT project that is behind schedule may be due to several factors such as inexperienced or frequently changing personnel (People), unclear project plans or lack of risk management (Process), inappropriate technology (Technology), delays from suppliers in delivering hardware or services (Suppliers), or constantly changing client requirements (Client). Using the Fishbone Diagram helps the project team quickly identify key causes and propose appropriate corrective actions.
Additionally, the Fishbone Diagram is widely applied in customer service, human resource management, financial analysis, and many other fields. In customer service, it helps analyze reasons for customer dissatisfaction, thereby improving customer care processes. In human resources, the diagram can be used to identify causes of high turnover rates, such as unattractive compensation packages, a stressful work environment, or lack of promotion opportunities. In financial analysis, it helps uncover causes of budget deficits or declining profits, such as rising operating costs, reduced revenue due to market fluctuations, or inappropriate pricing strategies.
Components of the Fishbone Diagram
- Fish Head (Main Issue – Effect) Position: Located on the right side of the diagram.
Function: Represents the problem or undesirable outcome that the organization is facing and needs to analyze the causes.
How to represent:
- Write concisely and clearly about the main issue.
- Use a rectangular box to enclose it and draw a straight line extending to the left to connect it to the “spine.” For example: If a company is facing the issue of “High product defect rate,” the content in the fish head will be “Defective products.”
- Spine (Main Axis – Spine) Position: A straight line extending from the fish head to the left.
Function: Serves as the main axis to attach the branches of causes.
How to represent:
- It is a long horizontal line originating from the fish head and extending to the left of the diagram.
- On the main axis, major bones (main cause branches) will spread out at diagonal angles.
- Major Bones (Major Cause Categories) Position: Large branches extending from the spine.
Function: Represents the major cause groups that may lead to the problem.
How to represent:
- Each major cause group is a diagonal line connecting to the spine.
- In manufacturing and quality management, the 6M model is often used to classify major causes: 6M Model commonly used in manufacturing and businesses
Cause Group | Meaning | Specific Example — | — | — Man (People) | Related to personnel, skills, attitudes | Employees not properly trained, incorrect operations, lack of staff Machine (Machinery, Equipment) | Related to technology, machinery, supporting equipment | Old machinery, poor maintenance, measurement errors Method (Methods, Processes) | Operational processes, working methods, production methods | Suboptimal processes, lack of clear standards Material (Raw Materials) | Quality and source of input materials | Substandard raw materials, supply fluctuations Measurement (Measurement, Quality Control) | Measurement systems, quality monitoring | Inaccurate measuring instruments, unsuitable standards Environment (Working Environment) | External factors affecting the work process | Humidity and temperature affecting products, noise reducing concentration
Note: In other fields such as services or information technology, the cause groups may vary, for example:
4S (System, Surroundings, Skills, Suppliers). 5P (People, Policies, Procedures, Plant, Product).
- Minor Bones (Specific Causes – Sub Causes) Position: Small branches extending from the major bones.
Function: Lists more detailed causes, helping to analyze the problem in depth.
How to represent:
- Small branches are drawn from the major bones, directed to the left.
- Use the 5 Why method to find the root cause. Illustrative example:
Problem: Defective products → Major cause: Faulty machinery
Why is the machinery faulty? → Because it was not maintained on schedule. Why was it not maintained on schedule? → Because there was no clear maintenance plan. Why was there no maintenance plan? → Because responsibilities were not assigned. Why were responsibilities not assigned? → Because the company did not have a periodic maintenance policy. Result: The root cause is the lack of a periodic maintenance policy.
- Direction Arrows (Cause Impact Directions) Position: Arrows on the diagram.
Function: Indicates the cause-and-effect relationship between the causes and the problem.
How to represent:
- Each cause will have an arrow pointing to the main issue.
- Subordinate causes will also have arrows pointing to their superior cause.
Summary of the Fishbone Diagram Structure
- Fish Head (Result/Main Issue).
- Spine (Main Axis of the Diagram).
- Major Bones (Major Cause Groups – 6M or corresponding groups).
- Minor Bones (Specific Causes, detailed from the major cause groups).
- Direction Arrows (Show relationships between causes and outcomes).
The fishbone diagram helps organizations clearly see the core causes of a problem, allowing them to propose effective solutions.
How to Apply the Fishbone Diagram
- Identify the problem: Clearly write the issue to be resolved at the “fish head.”
- Identify the major cause groups: Typically includes 6M (Man, Machine, Method, Material, Measurement, Environment).
- List specific causes within each group.
- Analyze the root causes by repeatedly asking “Why?” (5 Whys method).
- Propose solutions and implement actions to address the problem.
Step-by-Step Guide on How to Draw a Fishbone Diagram
To draw a fishbone diagram, you can follow these steps:
- Identify the problem to be solved: Clearly define the specific issue you want to analyze and resolve using the fishbone diagram.
- Draw the backbone: Start by drawing a horizontal or vertical line as the main backbone. Place the main cause on the right side of the backbone.
- Draw branches and bones: Draw sub-branches from the backbone and connect them to the main cause. On each branch, draw bones that represent specific influencing factors.
- Label and describe: Assign names to each branch and bone to represent the corresponding causes and influencing factors. Add brief descriptions or notes if necessary to clarify the meaning of each component.
- Review and finalize: Check the drawn fishbone diagram to ensure logic and connectivity between the components. Complete and edit the fishbone diagram if needed to create a clear and understandable diagram.
With the above steps, you can draw a complete fishbone diagram and use it to analyze and effectively resolve issues.
Advantages and Disadvantages of Fishbone Diagrams
- Advantages
- Helps identify root causes of problems: The fishbone diagram helps organizations pinpoint the actual causes of issues rather than just focusing on symptoms. It supports the 5 Whys method to delve deeper into root causes.
- Visual and easy-to-understand structure: Causes are categorized into groups, making it easier for people to visualize the problem and the approach to solving it. It is useful in group discussion meetings and brainstorming sessions.
- Supports teamwork and systems thinking: It promotes collaboration among team members as they analyze causes together and encourages everyone to contribute ideas from various perspectives.
- Applicable in various fields: Quality management, manufacturing, customer service, project management, human resources, finance, education, healthcare, etc.
- Easily integrated with other tools: Can be combined with Pareto Charts to identify the most significant causes; used alongside Six Sigma and Kaizen methods for quality improvement.
- Disadvantages
- Does not assess the impact level of each cause: The diagram only lists potential causes without indicating which ones are the most important. It needs to be combined with other data analysis tools like Pareto charts or statistical analysis.
- Subject to subjective opinions: If there is insufficient actual data, the causes presented may be speculative and unfounded. Verification of causes with data and facts is necessary.
- Not suitable for complex issues with closely related factors: If the factors interact in complex ways, the fishbone diagram may not fully represent their relationships. In such cases, mind maps or system models may be needed.
- Cannot make decisions if there are too many causes: If there are too many causes for the problem, the diagram can become unreadable and difficult to analyze. It is necessary to prioritize the main causes to avoid making the diagram overly complex.
Conclusion The fishbone diagram is a powerful tool for systematically and visually analyzing the root causes of a problem. It is particularly useful in fields such as quality management, manufacturing, project management, and customer service, helping organizations identify and resolve issues effectively. However, this diagram has the disadvantage of not measuring the impact level of each cause and can become complex if there are too many related factors. Therefore, to achieve the highest efficiency, it is essential to use the fishbone diagram in conjunction with other data analysis methods, such as Pareto charts or statistical analysis. When applied correctly, the fishbone diagram will be a valuable tool in improving processes and enhancing work quality.


